Meridian. Sight when you can't see.
Observability on every connection we supply. From the fibre in the ground to the application on the screen.
Talk to a network expert →
What is Meridian?
Meridian is Connected Networks’ own network observability platform. It shows you how your connectivity is performing, from your site across the internet to the applications and services your business depends on.
It brings measurements of your circuit, network paths and application response times into one place. You can see performance over time and use the evidence to understand what happened when service changes — rather than relying on whether a circuit is simply reported as “up”.
Meridian is included with every connection we supply on a Meridian Edge device. It also runs on circuits from other carriers, bringing the same granular, application-level visibility to the connections you already have.
How Meridian measures your network →
Everyone was sure. Nobody had the data.
A global commodity trader's trades kept failing. The trading platform blamed the ISP. The ISP's helpdesk said the circuit had been up throughout. The IT manager didn't know who to trust. The head trader wanted a new provider. We turned Meridian on. The next time trades dropped, we watched it happen: the circuit flat against its ceiling. Bursts of packet loss from a pipe that was full. Not a fault. Not the ISP. Not their kit. The fix was more bandwidth, a soft change made remotely. The alternative was a new supplier, a new contract and a wayleave — and the same full pipe.
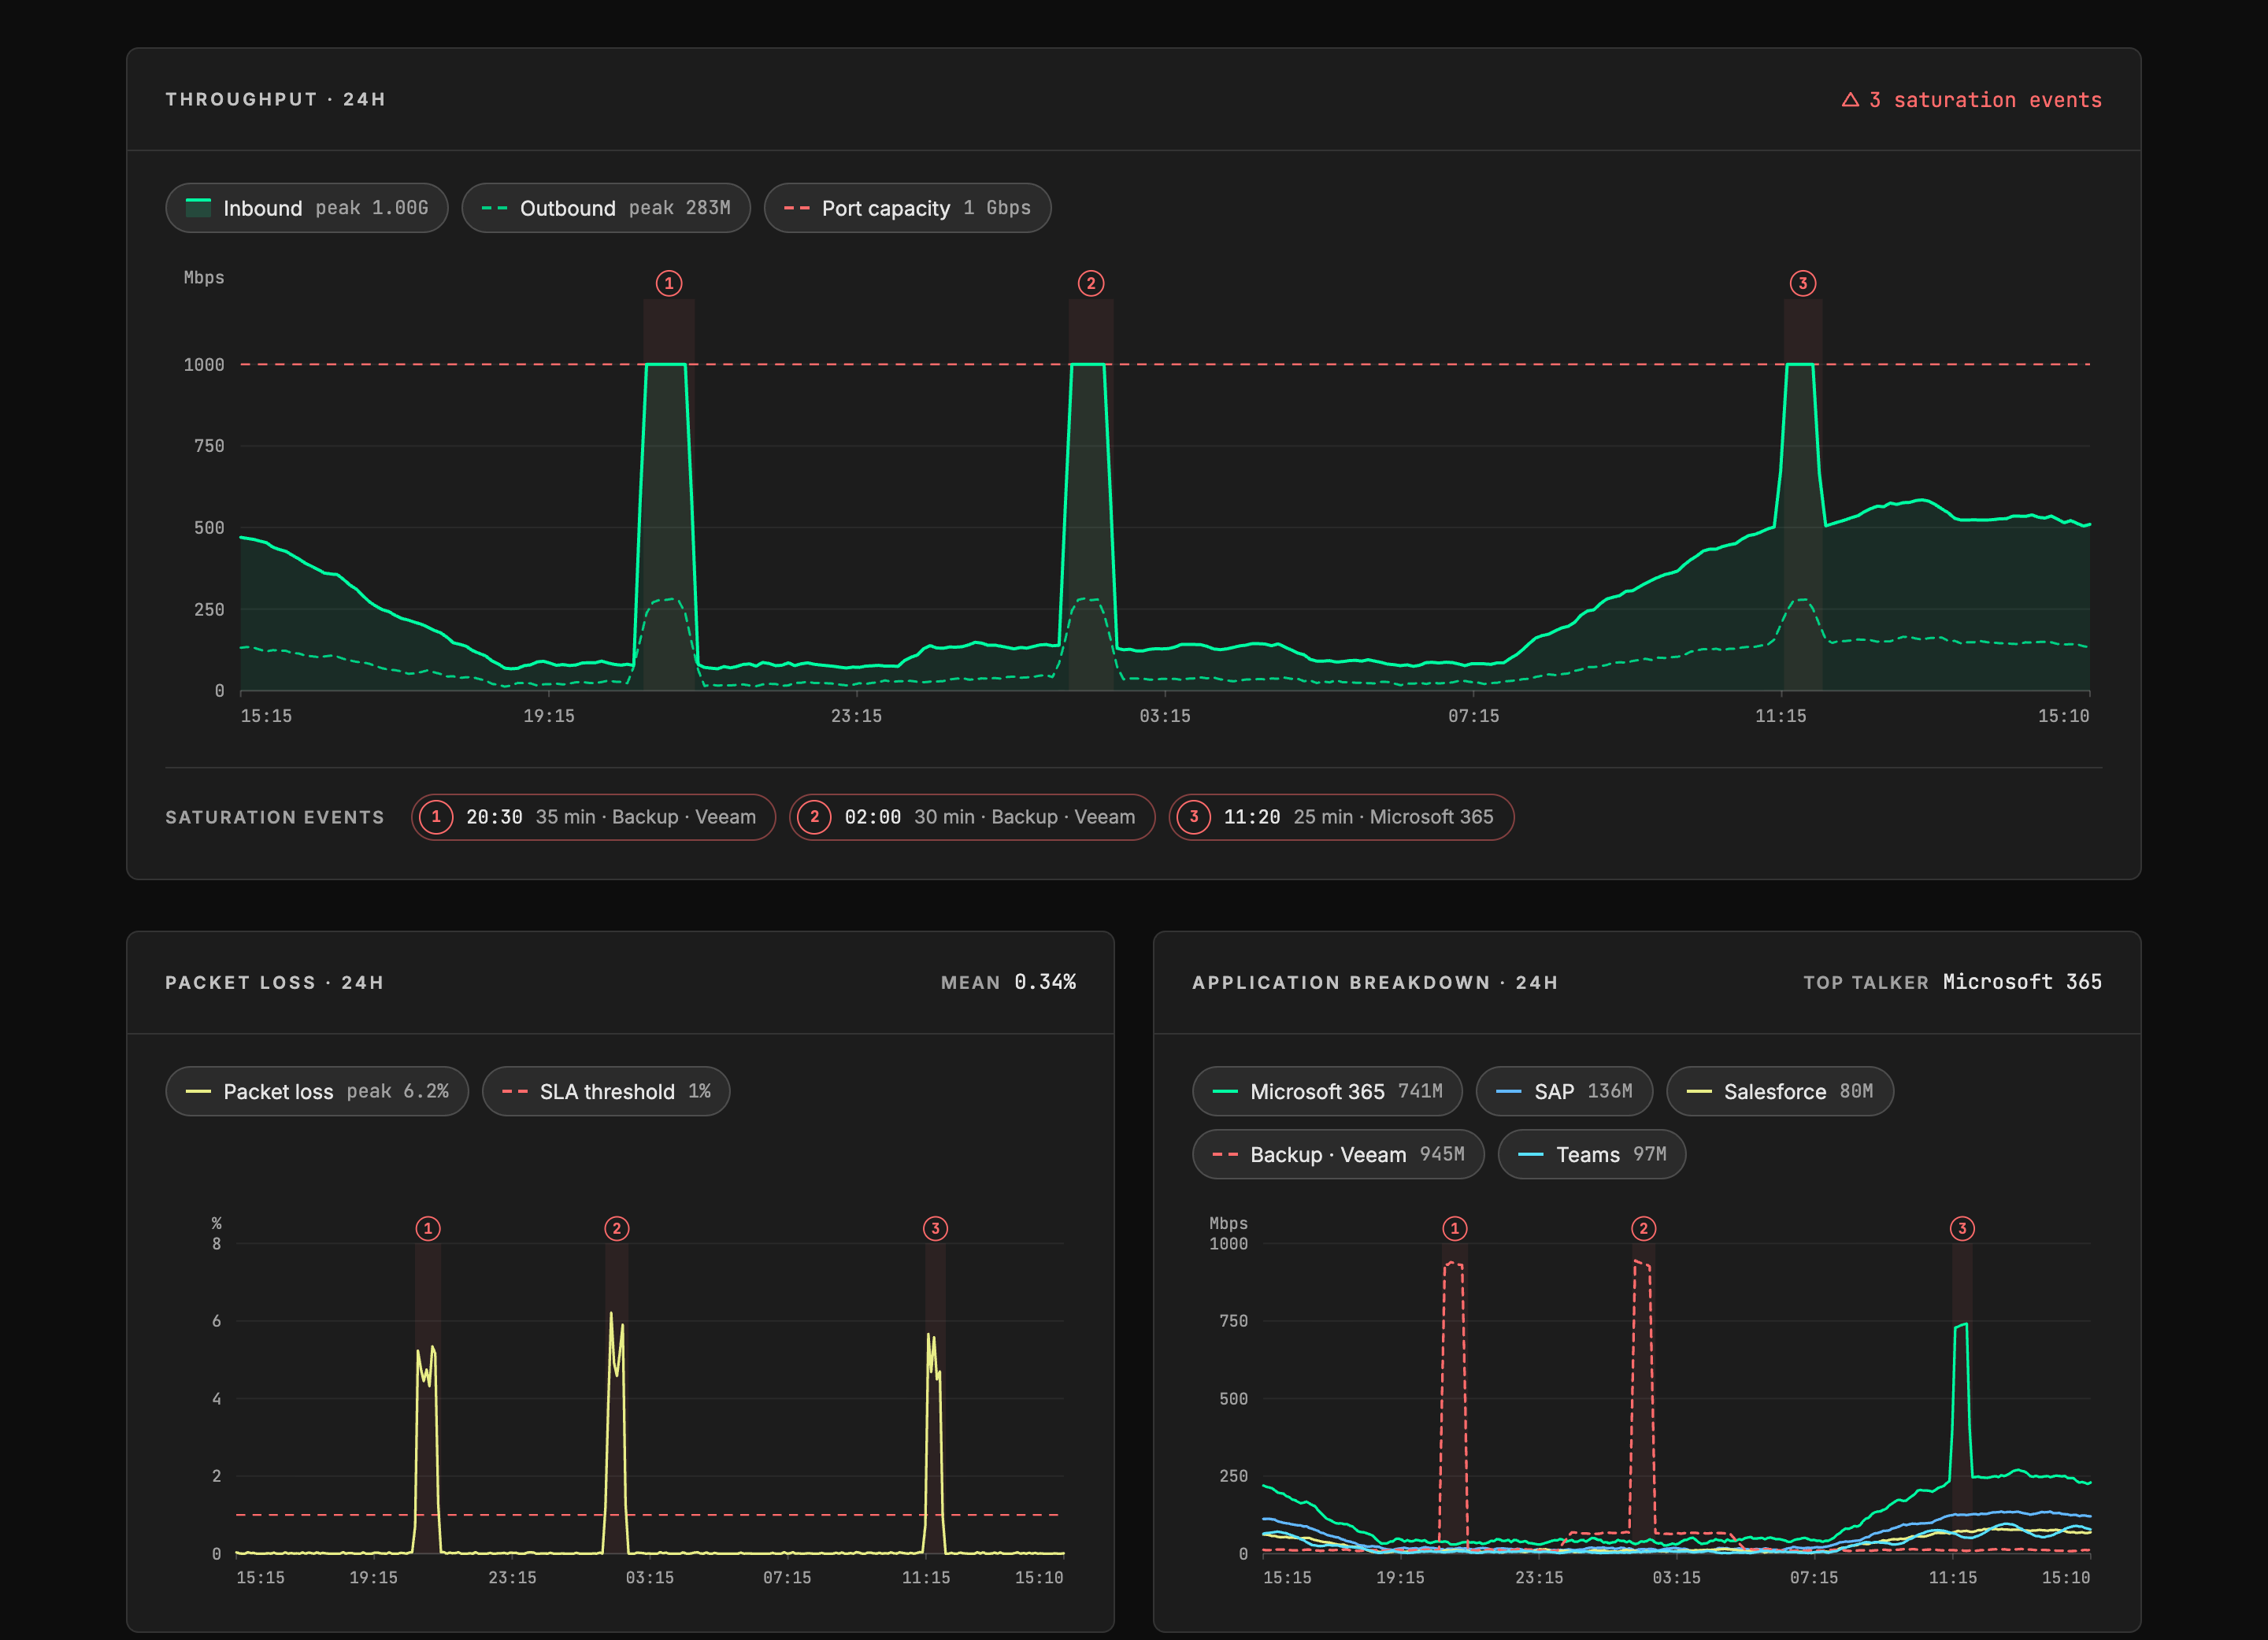
The circuit said up. The tills said otherwise.
For months, a retailer's stores couldn't take card payments — a few minutes at a time, several times a week. Our managed routers on site said up. Our probes said up. Every ticket came back the same: no fault found. We'd tried everything the tools could do. The only thing left was to believe the people telling us it was broken.
So we built a server outside their network and traced the path to the payment endpoints, continuously, for weeks. It found loss upstream, in the transit provider's network, at the exact minutes the tills went down. We sent them the timestamps. Their reply, word for word:
"We experienced network congestion caused by an attack. The attack was mitigated by our protection system, but there was a short delay before the sensor switched from sensor mode to always-on mode."— the transit provider, in writing
The attack was mitigated. So was the retailer's card traffic. We moved them to another path and it never happened again.
That server became Meridian.
For the engineers
The provider was under a subnet carpet-bomb DDoS: low-rate traffic spread across a whole prefix so no single destination trips a threshold. Their mitigation moved from sensor mode to always-on scrubbing across the range, and the retailer's legitimate card-terminal traffic was inside it. Nothing in the customer's network changed. Nothing on the access circuit changed. Only a continuous, timestamped trace from outside the customer's network could put the loss at the right hop and the right minute.
Where. Whose. When. Why.
Most tools can tell you that something's wrong. Meridian tells you the rest. It measures from your edge outwards and from our nodes back to you, so a fault is placed rather than guessed. It watches the internet's routing table, so a route change shows up as the cause rather than a mystery. It watches the box and the traffic through it, which is how a full pipe gets caught. Every layer, from the fibre in the ground to the application on the screen. Not what a dashboard said — what actually happened.
How it's measured, in detail →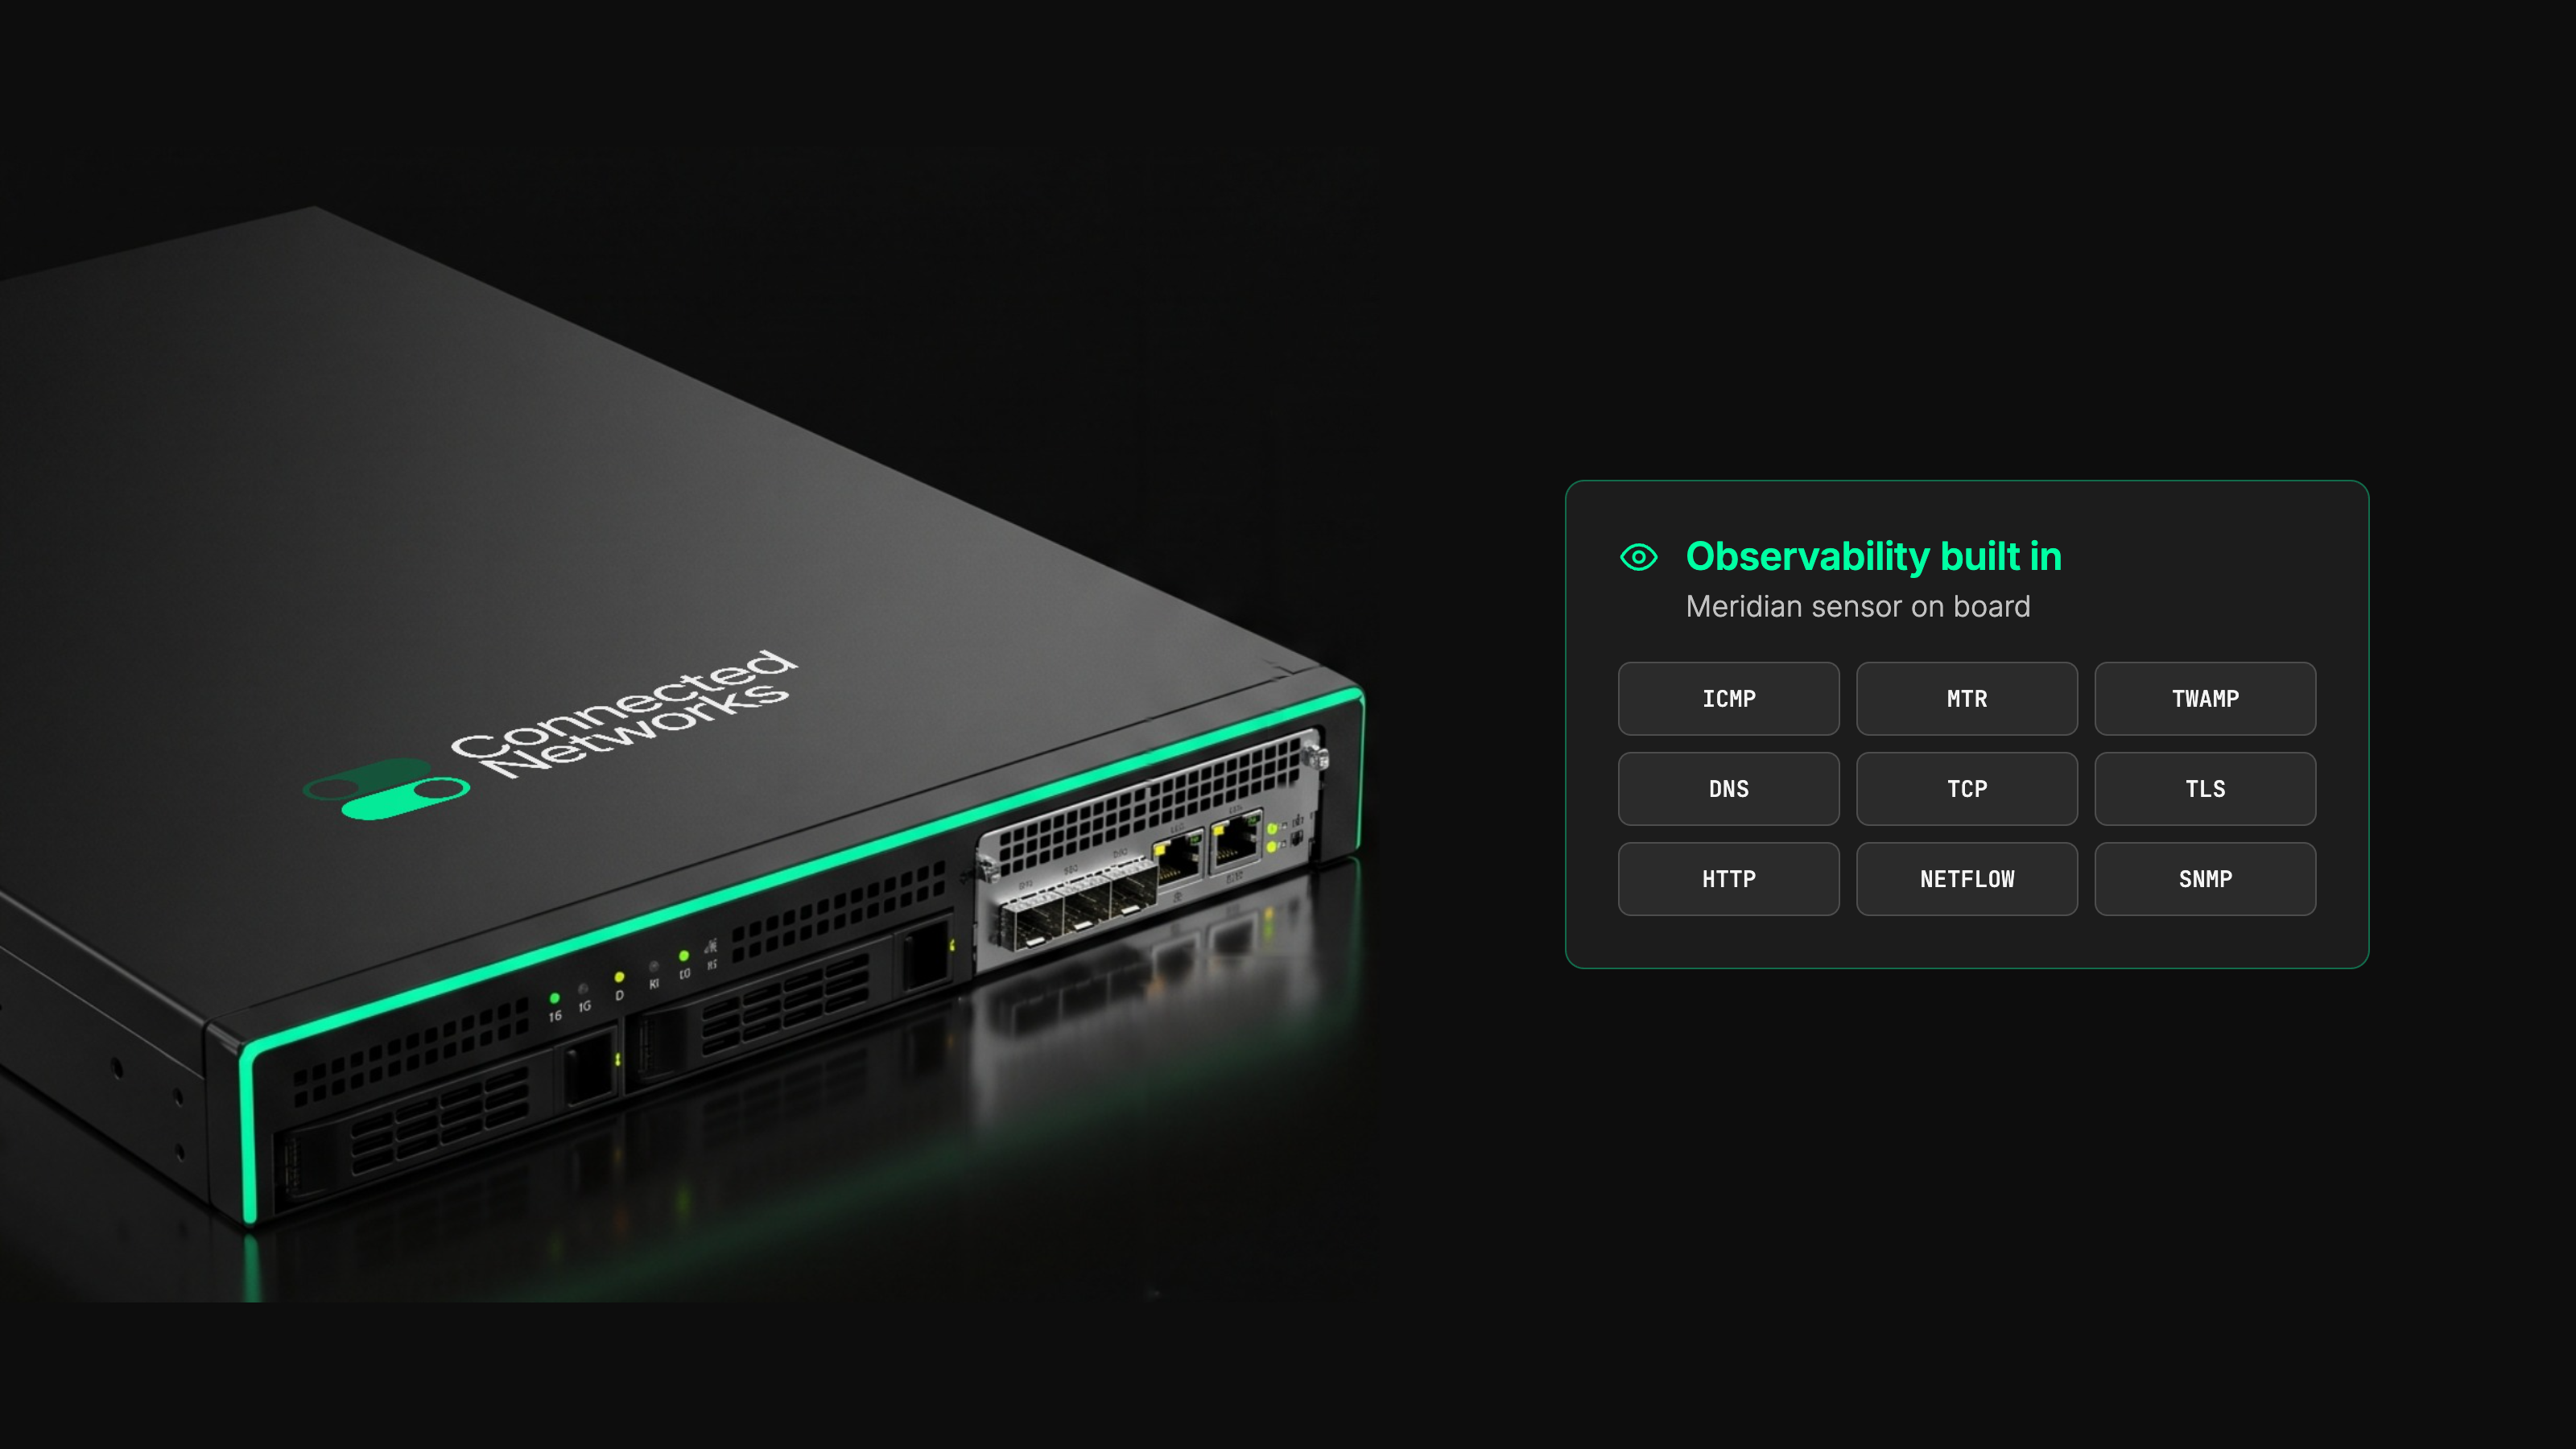
Every supplier gives you their version of what happened. We give you yours.
At 09:04 Meridian sees something. The people you've named for proactive notification hear about it first — before the calls start. Depending on what it is, our 24/7 service desk raises a ticket with the carrier straight away, or we watch it to see whether it clears on its own. If the carrier needs convincing, they get a data pack that shows the fault in detail: the path, the hop, the timestamps. If it isn't your connection at all — a wider internet or application problem — you're told that too, with what we'd suggest doing about it. Either way, you hear from us while it's open, including "still waiting on the carrier". You're never the last to know about your own network.
Meridian on every connection.
Basic — included with each connection
You can see your network.
ICMP · latency, loss, jitter · MTR Inbound, MTR Outbound · TCP, TLS and HTTPS · internet routing · device status, traffic flows
The standard set: cloud regions, major SaaS, internet baseline
Uptime, latency, SLA
30 days
Evidence pack
Portal
Pro — £49£99£149€59€119€179$69$139$199 /site/mo
You know what happened and why.
Basic + high-frequency, TWAMP two-way measurement
Basic + unlimited, custom
Basic + trends, executive reports
12 months
Basic + causal narrative, correlation across sites
Basic + API
Both run on the same edge device. Moving up is a software licence, applied remotely — no site visit. Itemised separately from the circuit on every quote.
Sight when you can’t see.
Meridian shows you how your connectivity is performing, from your site across the internet to the services you depend on. It’s included with every connection we supply. It also runs on circuits from other carriers, bringing the same granular, application-level visibility to the connections you already have.