Meridian methodology

How Meridian measures.

What we will measure, from where, how often, and why.

The Meridian Edge device provides a measurement position on the carrier side of your firewall, looking outward through your circuit.

The planned measurement model.

This page describes the capabilities we will measure as the model is delivered. It is not a statement that every capability or destination is available today. We will confirm what is available for your site before you commit.

Explore Meridian →
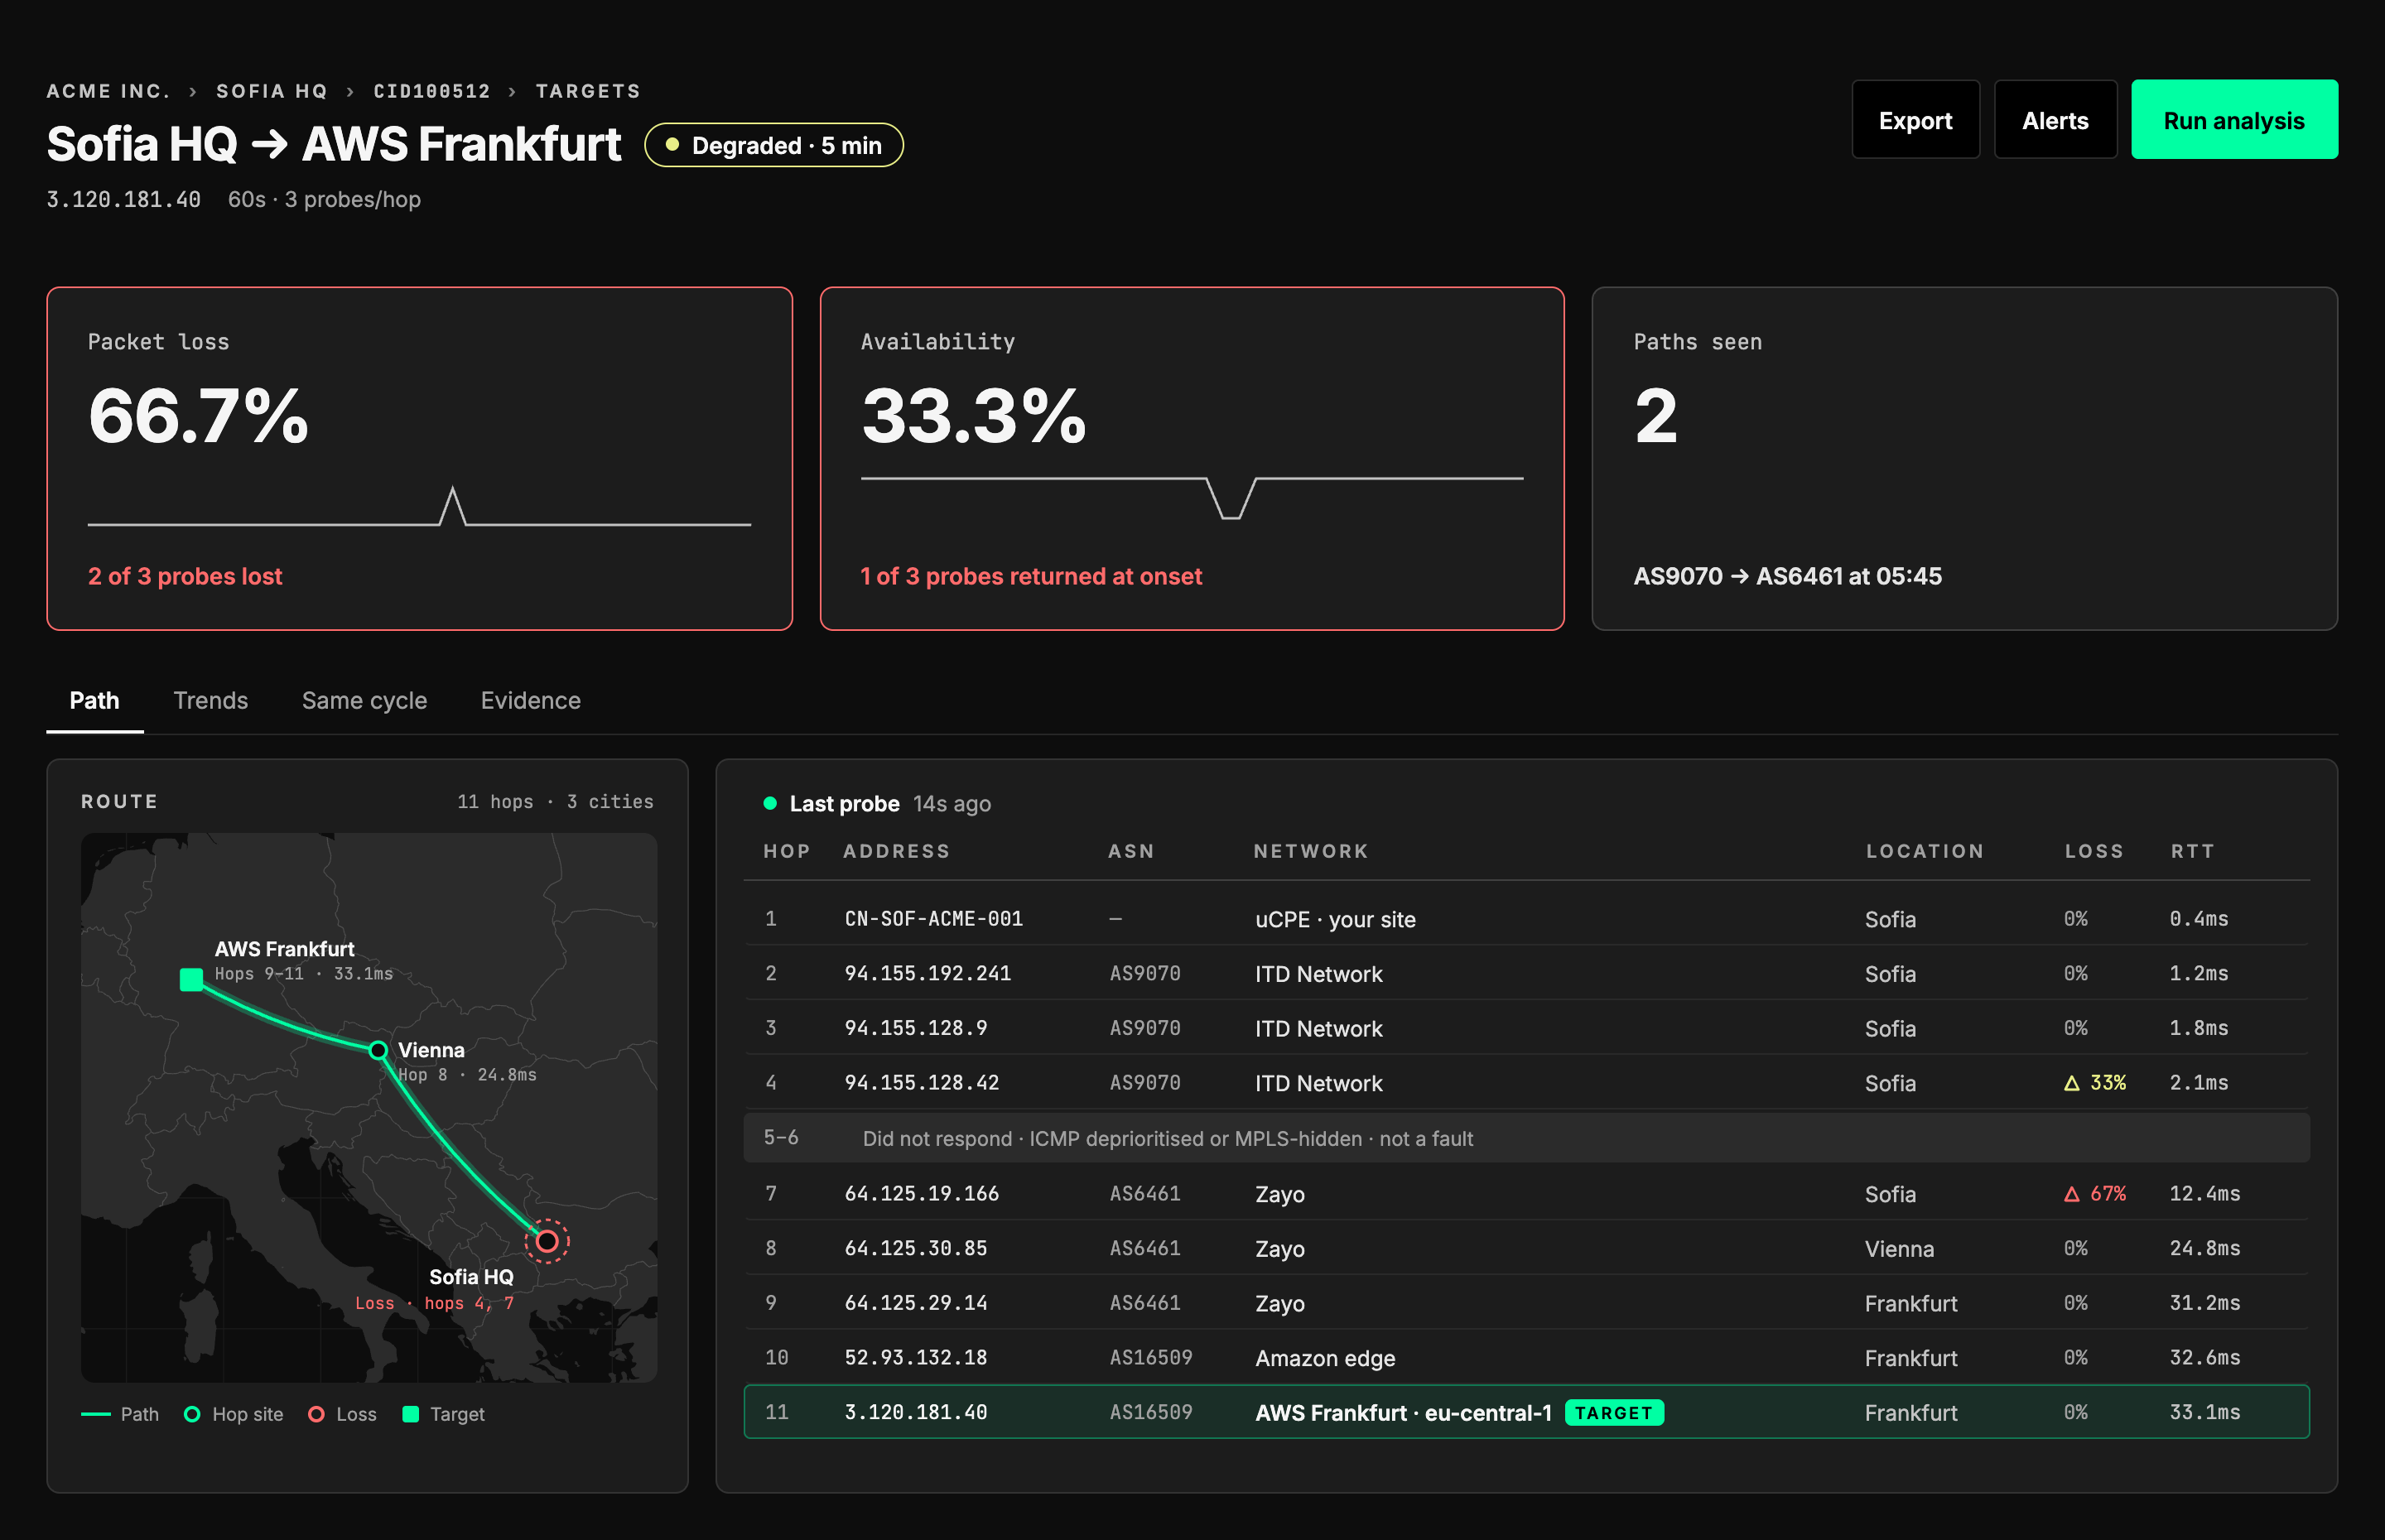
Current Meridian path view showing a site’s network hops and measurements
Current-interface example. The displayed probe count reflects the existing screen, not the planned profile described below.

If you’ve been sent this page.

When an application is slow, the investigation can involve the circuit, carrier, internet path, security-platform on-ramp, cloud provider or application. Meridian’s planned measurement model will bring these observations together from the customer’s edge.

The aim is evidence that helps narrow the investigation and assess responsibility, while keeping uncertainty visible. Meridian also runs on third-party circuits; supplying the circuit is not a prerequisite for that visibility.

The seat is on our router, not in your network.

On a connection we supply, the Meridian Edge device sits between the carrier’s hand-off and your firewall. The active measurements described here will be initiated outward from that position, through the circuit toward the internet.

The measurement model will not probe your LAN, inspect packet payload or measure individual users. Device counters and flow metadata will provide additional context at the edge.

Eight measurements. A clearer picture of performance.

Quality — fifty probes per protocol, every five minutes

Each destination will receive fifty ICMP probes and fifty TCP probes on port 443 every five minutes. Meridian will record loss, round-trip time distribution, jitter and reordering.

With fifty probes per protocol, each lost probe will represent two percentage points of loss in that protocol’s sample. Repeated samples will show how performance changes over time.

TCP probes on port 443 will provide another view of reachability and response alongside ICMP. Differences between the two will inform the investigation; application requests will provide the application-level measurements.

Topology — loss and round-trip time at every hop

Every destination will be traced hop by hop, with loss and round-trip measurements along the path.

We will compare loss across the path and at the destination to identify where degradation begins. A hop that answers fewer probes will not, on its own, be treated as evidence of a forwarding fault.

Attribution — which network owns each hop

Meridian will attribute responding hops to their operating networks and check that attribution against public routing data, rather than relying on an address alone.

Five probes will go to each hop. Some routers do not respond to probes; silence alone will not establish that a router has failed. Meridian will retain that uncertainty, marking inferred ownership explicitly and reporting unknown where ownership cannot be established.

Unknown will be a legitimate result. An inferred owner will not be presented as a verified one.

Application — a timed request, split into four phases

Meridian will make a request to each configured application destination and time DNS resolution, TCP connection, TLS negotiation and HTTP response separately.

Those timings will help narrow the investigation. We will read them alongside path and device measurements, rather than treating a slow phase as conclusive proof of responsibility.

One-minute cadence on the destinations in your service

The destinations configured for higher-frequency measurement will be measured every minute. More frequent samples will provide a closer view of short periods of degradation that less frequent sampling may miss.

The destination set and measurement frequency will depend on the service configured for that site. Neither cadence will be presented as a guarantee of detecting every short interruption.

Direction — two-way measurement to reflectors we run

Meridian will run two-way active measurement from the device to reflectors we operate, reporting loss and delay by direction.

Directional results will help narrow the investigation. We will combine them with path and interface evidence to assess responsibility. One-way delay interpretation will account for the timing accuracy required by the measurement method.

The circuit’s own counters

Meridian will read interface errors, discards and utilisation from the Meridian Edge device, alongside the active measurements. Those counters will help identify local interface conditions without treating every error or discard as proof of a physical circuit fault.

The device will also record traffic flows crossing it: destinations and volume, not packet payload. That information will help identify application destinations to consider for measurement.

The control — a target that is meant to fail

One in every six targets will be a known-silent control destination that is expected to time out. Unexpected results will flag the measurement process for investigation.

Each stored data row will carry a provenance label: verified, inferred or unknown. A measurement that did not happen will not be reported as a successful measurement with zero loss.

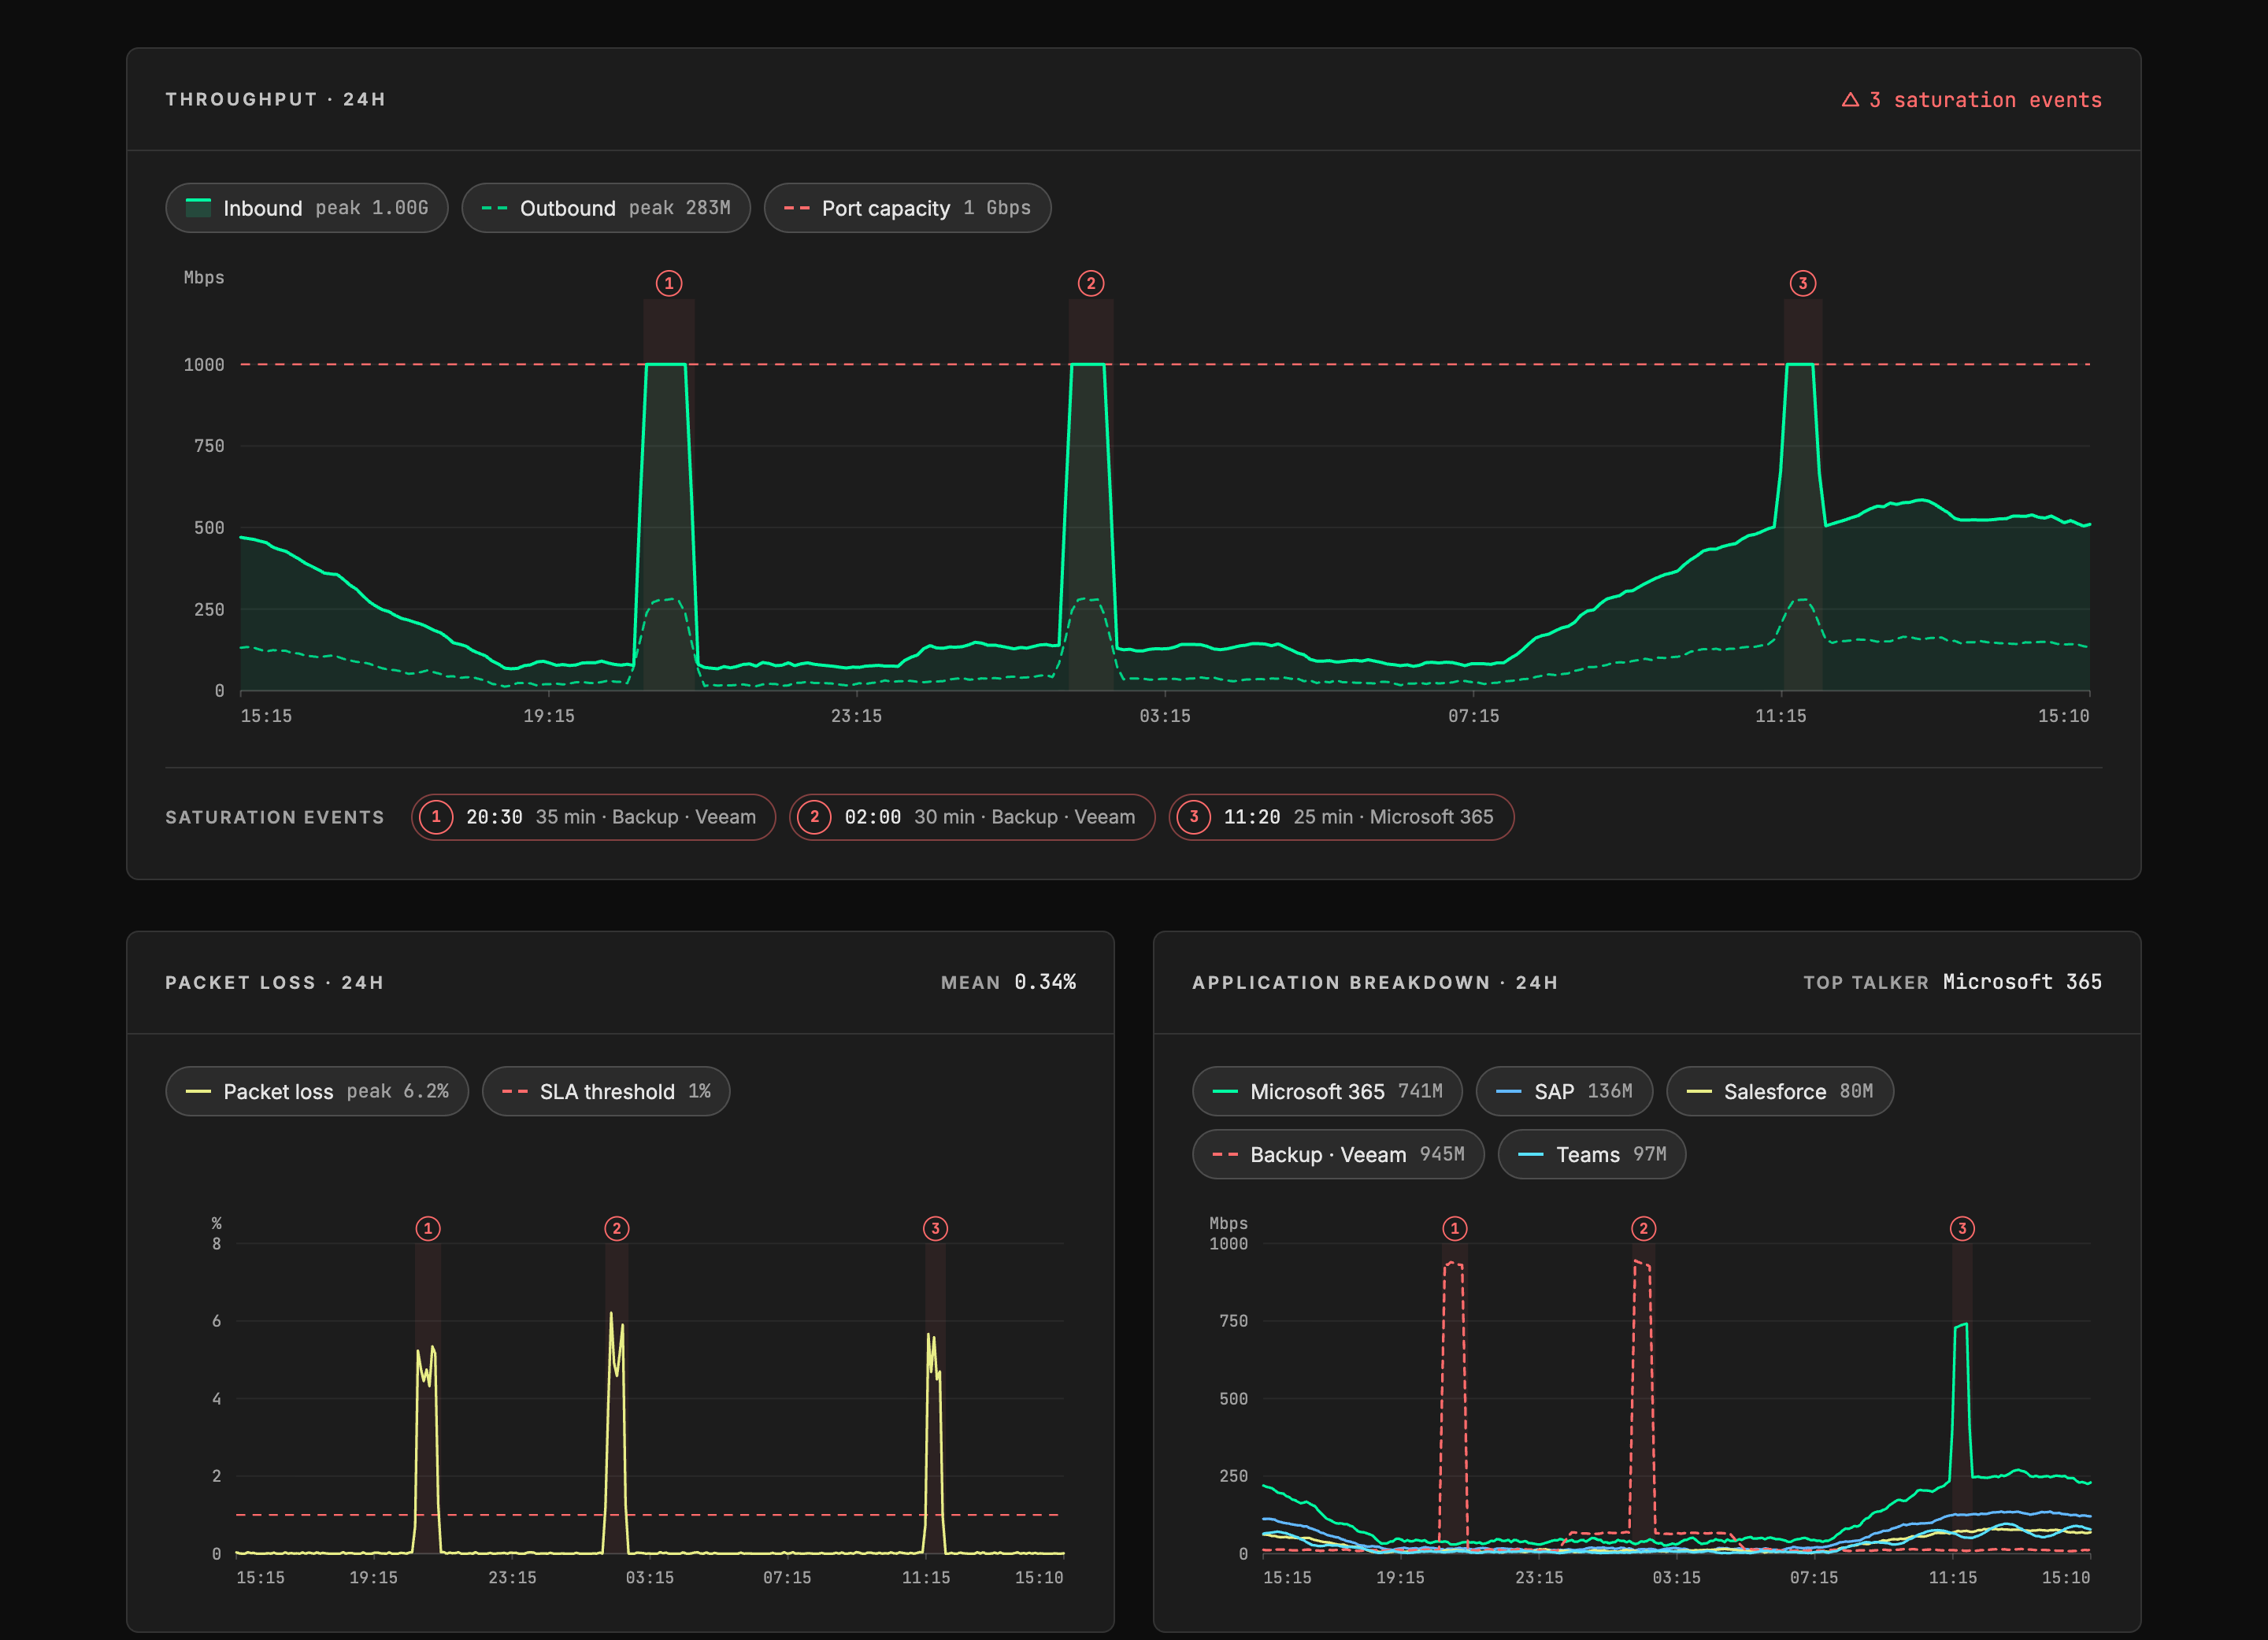
Current Meridian Casablanca traffic panels showing throughput, packet loss and application breakdown over 24 hours
Current-interface example: throughput, packet loss and application breakdown. This illustrates the existing presentation, not completion of every planned measurement.

What each site will measure, and why.

Your circuit
The first hop beyond the device and a collector we operate on the far side will provide reference points for measurement through the circuit.
Resolvers
The destination set will include commonly used public DNS resolvers and the resolvers configured for the site.
Beacons we control
Endpoints we operate in major cloud providers will give us visibility of the far end too, helping distinguish endpoint problems from path degradation.
Business applications
The planned application set will include Microsoft 365, Teams, Google Workspace, Salesforce, Zoom, Slack, Atlassian, GitHub, DocuSign and HubSpot.
Security-platform on-ramps
The planned profile will include the five closest Cato points of presence and the five closest Zscaler data centres for each site, providing measurements of the path to those entry points.
Cloud regions
The planned destination matrix will cover every AWS, Azure and Google Cloud region, using region-specific endpoints we operate. This is the intended coverage, not a statement that every endpoint is deployed today.
Your own applications
Named destinations supplied at onboarding, together with destinations identified through traffic-flow data, will inform the site’s configured target set. Only destinations reachable from the measurement position will be tested.
A consistent method across sites.

Every site will use a consistent measurement method. The destination set and measurement frequency will depend on the service configured for that site.

Consistent measurement across sites will make results comparable by destination, region and carrier. Those comparisons will provide context alongside the measurements from an individual circuit.

Meridian Basic and Pro →

Where the measurement stops.

Meridian will measure from the device outward. It will not see the condition of your LAN, Wi-Fi, endpoints or the connection between a user’s laptop and the switch.

A clean result will help narrow the investigation, but will not establish the condition of those unmeasured parts of your network. Results will describe the measured destinations and the times sampled.

Questions engineers ask.

How often will Meridian measure?

The planned baseline is fifty ICMP probes and fifty TCP probes per destination every five minutes. Destinations configured for higher-frequency measurement will be tested every minute. Interface counters and traffic-flow data will provide additional device-side evidence.

Will the Meridian Edge device see inside my network?

The measurement position is on the carrier side of your firewall. The planned probes will go outward through the circuit, not into your LAN. Flow records will describe destinations and traffic volume, not packet payload or individual-user activity.

How will Meridian identify the network behind a hop?

Attribution will be checked against public routing data. Five probes will be sent to each hop, but a lack of replies will not establish failure. Inferred ownership will be labelled, and unknown ownership will remain unknown.

Will Meridian distinguish upstream and downstream performance?

The planned two-way measurements will report loss and delay by direction. These results will be interpreted with path and interface evidence; direction alone will not establish responsibility.

How will I know a measurement actually happened?

Stored rows will carry verified, inferred or unknown provenance. Known-silent control targets will help check the measurement process. Missing measurements will not be represented as zero loss.

Will every site measure the same destinations?

Every site will use a consistent measurement method. The destination set and measurement frequency will depend on the service configured for that site. We will confirm the available profile and any planned additions when discussing your requirements.

Talk to a network expert.

We’ll walk the measurement model against your architecture, explain what is available today and distinguish it from what is planned. We’ll also confirm which destinations and measurement frequencies fit your requirements.

Talk to a network expert →Explore Global Connectivity →